Glassnode: Late 2025 Bitcoin Buyers Are Capping Rallies Near $87K
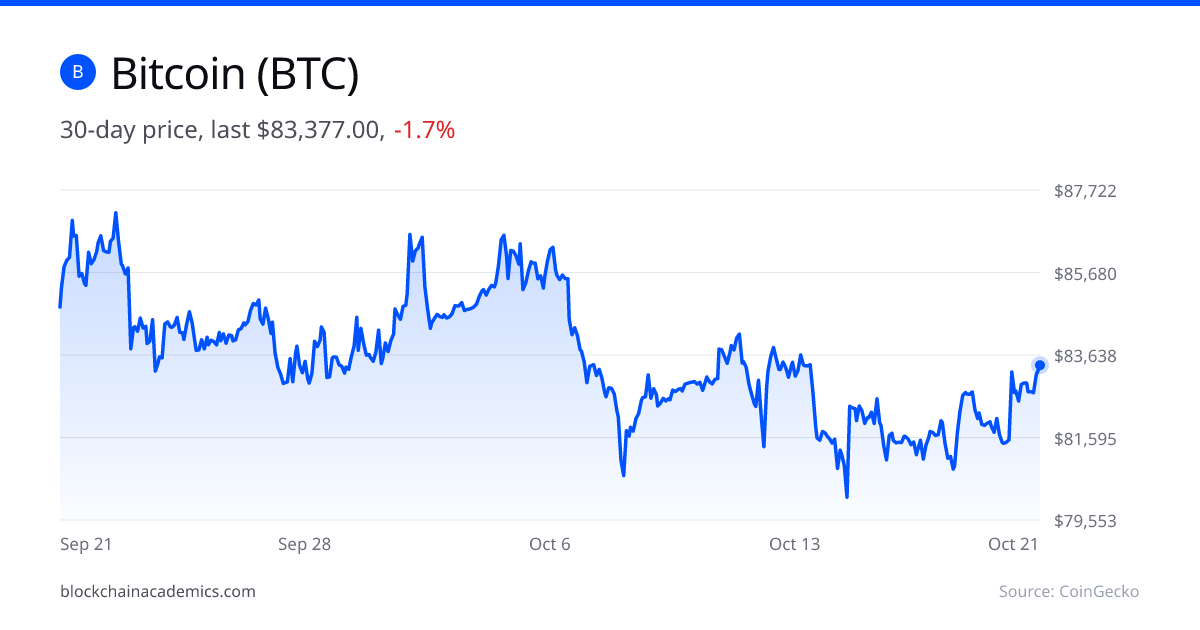
Bitcoin keeps hitting a wall near $87,000. Glassnode says late 2025 buyers selling at break-even built it, with the 6-12 month cost basis at $87,700 and support stacked between $80K and $81.5K.
Bitcoin's wall at $87,000 is made of people trying to get their money back. That is the read from Glassnode's on-chain research, which says resistance there comes largely from investors who bought BTC in late 2025 and are now selling at break-even.
Glassnode places a dense resistance zone at roughly $87K to $88K, with the tightest band at $87K to $87.8K. The cost basis for the 6-12 month holder cohort sits at $87,700, per the firm's analysis, and the 1-2 year cohort's is at $99,500. Other markers stack in the same area: the 2026 open at $87,490 and the 20-month simple moving average at $87,165. Glassnode also flags another supply cluster around $90K.
Bitcoin has recently traded between $82K and $84K, on thin volumes and mixed flows into US spot Bitcoin ETFs.
The cohort history explains why these levels bite. Price lost the 6-12 month cost basis in November 2025, when it was $94,000, and a January 2026 attempt to break the trendline at $97,100 was rejected. The 1-2 year cohort slipped into aggregate loss in February when price lost its $76,900 cost basis, and that same level halted a rebound just above $82,000 in May. Glassnode summed up the pattern:
"Bitcoin rose to the 6-12 month cost basis in January and then fell by more than a third. It met the 1-2 year cost basis in May and fell by about a quarter,"
Glassnode
Sellers are not done, either. Glassnode said the "1-2 year holders also stepped up their selling into the rally at the start of October."
Where support sits
Below spot, the map is just as crowded. The US spot ETF cost basis is about $81,500, and the True Market Mean sits around $77,500 to $78K. Short-term holder breakeven is at $74,600. The $80,000 mark is a psychological level where bid liquidity concentrates, with a liquidation cluster just beneath it. Glassnode described how those layers interact:
"The block sits just under the US Spot ETF Cost Basis, so the zone between $80K and $81.5K is where order-book and on-chain support overlap. A break below it would bring the liquidation cluster just under $80K, and then the True Market Mean near $78K, into play,"
Glassnode
The bull case, and the catch
There is a counter-argument. Older holders are showing reduced selling pressure, and Glassnode reads the result as a consolidation phase. The 20-month SMA is also described as a level that has historically preceded new all-time highs once reclaimed as support.
The catch is demand. Mixed spot ETF flows suggest institutional buying is not strong enough to absorb supply from recent buyers who just want out flat.
For traders, the setup is a range with defined edges: roughly $80K to $81.5K below, $87K to $88K above, and a $90K cluster behind that. A clean reclaim of the $87K band, particularly the 20-month SMA, is the signal to watch. Until then, rallies into that zone have a record of getting sold, and a loss of $80K opens the liquidation pocket beneath it. For a longer-horizon counterpoint, see JPMorgan Asset Management's first Bitcoin return forecast.