XRP Drops 10% to 87 Cents, Lowest Since November 2024
XRP slid about 10% to near $0.87, its lowest since November 2024. Roughly 94% of $18M in XRP liquidations were longs, funding flipped negative, and spot XRP ETFs bled $4.97M as net assets fell to about $990M.
XRP fell about 9% in 24 hours to near $0.87 on Saturday, Nov. 21, its lowest price since November 2024. A broad crypto selloff wiped out leveraged longs. The token is down 11.5% on the week.
Price data showed XRP at $0.87, down 10.02%. Bitcoin lost 9.4% over the day and ether more than 10%. Solana fell more than 9%, HYPE 14% and ZEC 19%.
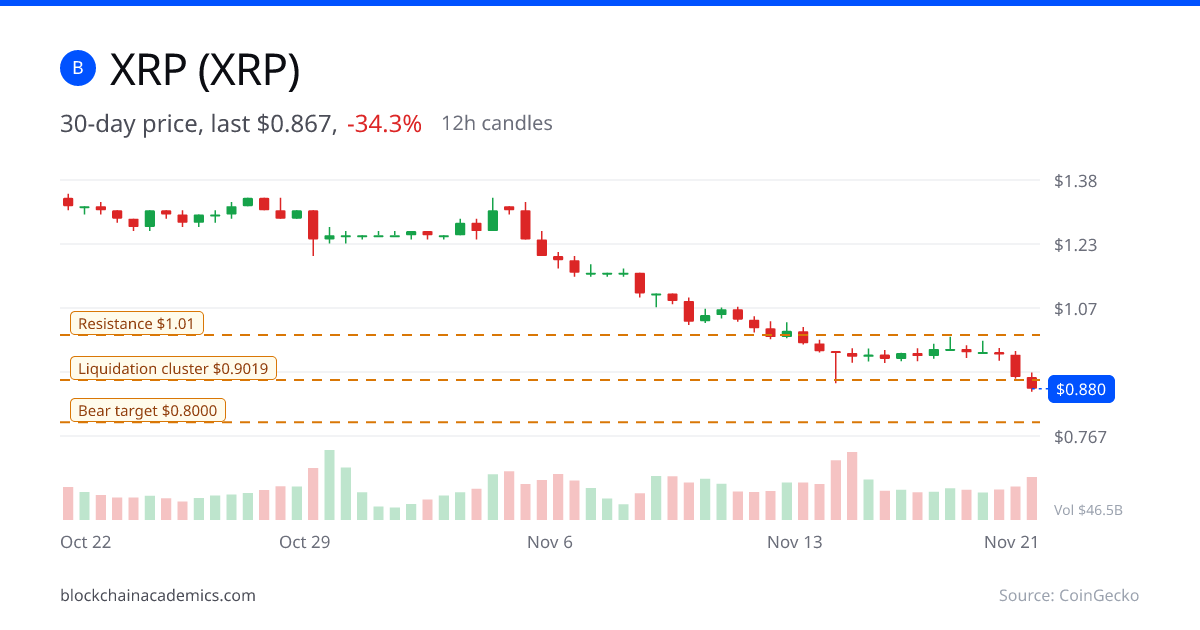
The $1 level did not last. XRP reclaimed it on Nov. 18 on a short squeeze, then gave it back. Then $0.95 went too. That level had acted as short-term support after a rebound off $0.90, and volume rose about 28% as it broke.
Leverage unwinds
CoinGlass data shows about $18 million in XRP futures positions were liquidated over 24 hours, roughly 94% of them longs. Open interest stood near $1.77 billion and volume topped $3 billion. Funding rates turned negative on major exchanges, meaning shorts are now paying longs.
The flush was market-wide. Long liquidations across crypto reached nearly $1.4 billion in 24 hours, per CoinGlass. The Crypto Fear and Greed Index fell to 8, its lowest since February. The slide follows Bitcoin's drop below $62K on Friday, when $727 million in leveraged positions were liquidated.
ETFs and technicals
U.S. spot XRP ETFs posted about $4.97 million in net outflows Friday, per SoSoValue, concentrated in Bitwise's fund. The five funds hold about $990 million in net assets against roughly $1.78 billion in cumulative net inflows since launch.
Over 30 days, XRP is down about 36%. Daily RSI sits near 24, oversold. MACD remains below its signal line. The token trades below its 50-day average near $1.17 and its 200-day near $1.31. Liquidation heatmaps show clusters near $0.9019 and $0.8934.
Ali Charts had flagged $0.80 if $0.99 support failed. Nearest daily resistance sits at $1.01, with $1.20 beyond it. The nearest chart support is around $0.63.
What it means
Oversold readings often precede relief bounces. RSI alone does not mark a bottom. A daily close above $1.01 would cancel the breakdown and open a run toward $1.20. With leverage crowded on both sides, a fast squeeze can hit in either direction.
Estimates of the daily drop vary with timing: one snapshot put the day's dip at about 4%. The figures above use the timestamped 24-hour data.