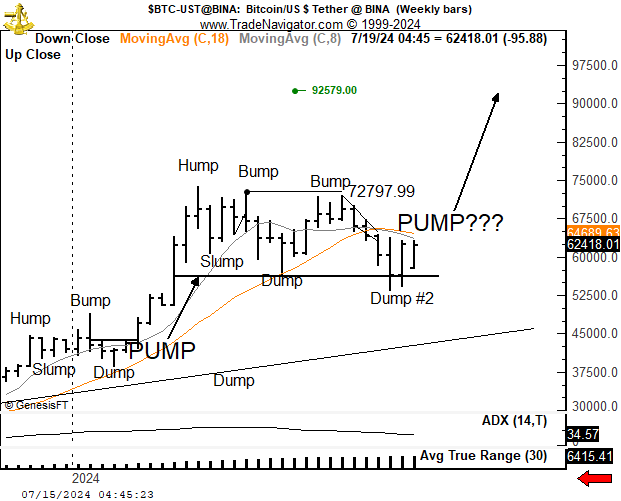
Renowned veteran Trader Peter Brandt sets a $92,579 price target for Bitcoin (BTC) amid the ongoing recovery push, calling attention to a recent bear trap.
Brandt shared this analysis on X earlier today, suggesting Bitcoin could finally re-enter a price discovery phase. The analyst’s interpretation revolves around a pattern he calls “Hump…Slump…Bump…Dump…Pump.”
Brandt’s Interpretation of BTC’s Price Movements
According to the veteran trader, Bitcoin’s recent price movements have mirrored this pattern. Interestingly, this reality signals a potential bullish surge which aligns with an imminent “pump.”
Bitcoin $BTC could be unfolding its often-repeated Hump…Slump…Bump…Dump…Pump chart construction.
Jul 5 attempt at double top was bear trap, confirmed by Jul 13 close
Most likely scenario now is that bears are trapped
Close below $56k negates this interpretation pic.twitter.com/jQZn8GGrS2— Peter Brandt (@PeterLBrandt) July 15, 2024
In the analysis, Peter Brandt confirmed that Bitcoin experienced the “Hump” when it surged to the ATH of $73,794 in March. After this, the “Slump” occurred, leading to a low of $60,760 on March 20. The first “Bump” then resulted in a spike to $72,797 in April, but Bitcoin faced resistance at this level.
This resistance triggered the subsequent “Dump.” The bears capitalized on this Dump to push Bitcoin to a 10-week low of $56,500 on May 1. Bitcoin recovered to trigger the second “Bump,” which allowed it to reclaim the $71,000 territory. However, another “Dump” occurred, which produced the latest market collapse.
A Bitcoin “Pump” to $92,579
With Bitcoin now looking to recover from this drop, Peter Brandt expects the “Pump” to occur in the near future. He set a target of $92,579 for this pump. This contrasts his earlier prediction that BTC might have already hit its top for the cycle.
Brandt highlighted a critical moment when Bitcoin attempted to form a double top on July 5. Such a pattern appeared bearish to the market. However, this bearish sentiment was quickly reversed, confirmed by a bullish close on July 13. Interestingly, the analyst stressed that this occurrence was a classic bear trap.
With the bears trapped, Brandt’s analysis suggests an imminent upsurge. He presents a crucial support level around $56,000, pivotal for maintaining the bullish outlook. A close below this threshold would invalidate the bullish scenario and suggest a further bearish trend.
Conversely, the resistance level stands at the previous peak of $72,797 in April. The chart also reveals that Bitcoin’s weekly ADX (Average Directional Index) sits at 34.57. This figure suggests a relatively strong trend. In addition, the ATR (Average True Range) currently at 6,415.41 points to high volatility.

Bitcoin Sees Renewed Strength
Traders should monitor these key support and resistance levels closely, considering the high volatility. Meanwhile, Bitcoin currently trades for $62,959, up nearly 10% since July 12. This price surge is part of a recovery push following the German government’s exhaustion of its Bitcoin holdings.

The Relative Strength Index (RSI) has recovered to 57.22 at press time, signaling renewed strength in the market. Additionally, the Moving Average Convergence Divergence (MACD) line has crossed above the Signal line for the first time in July, further supporting a bullish outlook.
This combination of bullish technical indicators suggests that Bitcoin might be looking to sustain the upward momentum. The trend aligns with Brandt’s analysis of a potential bullish surge towards $92,579.
Disclaimer: This content is informational and should not be considered financial advice. The views expressed in this article may include the author’s personal opinions and do not reflect The Crypto Basic’s opinion. Readers are encouraged to do thorough research before making any investment decisions. The Crypto Basic is not responsible for any financial losses.
-Advertisement-
This article was originally published by a thecryptobasic.com . Read the Original article here. .

